
The Baojun 360
The Baojun 360 is a compact multi-purpose vehicle (MPV) produced by Baojun, a Chinese automobile brand. Baojun is a joint venture between General Motors (GM), SAIC Motor Corporation, and Wuling Motors. It is positioned below the Baojun 730 within Baojun’s lineup. Below we share the sales data for the Baojun 360 in China (it’s main market).
Baojun 360 Overview
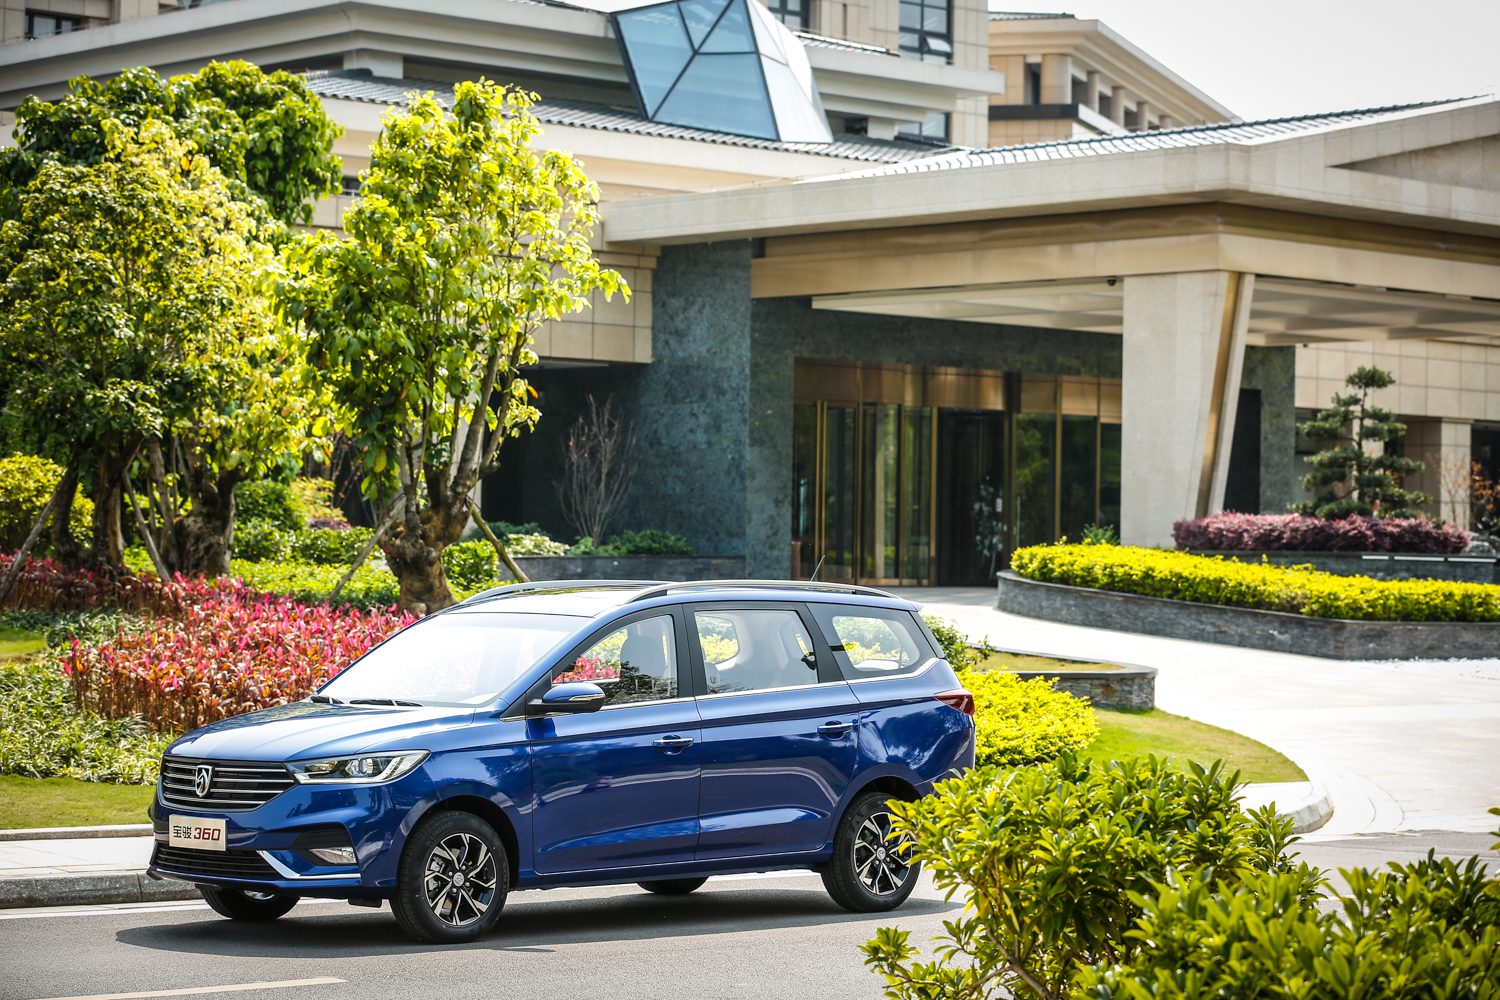
The Baojun 360 was first introduced in 2018 and is designed for the Chinese market. As an MPV, its primary focus is on providing practicality, versatility, and comfortable seating for multiple passengers. MPVs are popular in China due to their spacious interiors and ability to accommodate larger families or groups. The Baojun 360 features a modern and practical design typical of compact MPVs. It has a boxy shape with a tall roofline, allowing for ample headroom and a spacious interior. The sliding rear doors make it easy for passengers to access the rear seats, especially in tight parking spaces.
The 360 is powered by a 1.5-liter naturally-aspirated engine that produces 82 kW (110 hp; 111 PS) and 146.5 N⋅m (108 lb⋅ft) of torque. It is available with either a 5-speed manual transmission or a CVT. The 360 has a spacious interior that can seat up to 7 passengers. The cargo space measures 1,350 liters, which can be expanded to 2,050 liters by folding down the rear seats. The 360 comes standard with a variety of features, including a 7-inch touchscreen infotainment system, a rearview camera, and Bluetooth connectivity. Available features include a sunroof, a parking sensor, and a cruise control.
Baojun 360 Sales Data & Trends
The Baojun 360 starts at ¥56,800 (around $8,800). It is a good choice for buyers who are looking for a cheap and practical MPV. Overall, the Baojun 360 is a good choice for buyers who are looking for a cheap and practical MPV. It is not the most exciting car on the market, but it gets the job done. Sales started strongly but has declined very quickly and now sells just a trickle. It is like discontinued.
Baojun 360 China Sales Data & Charts
Sales figures for the Baojun 360 in China. Car sales statistics from China only include domestic production and exclude imported models.
China Annual Sales
China Annual Growth
Sources: Manufacturers, Chooseauto.


