Become a Member: Get Ad-Free Access to All Our Content
Members
U.S
Research Hubs
US Sales Hub
Sales by Year (Totals)
Sales by Brand
Sales by Segment
Sales by Automaker
Best Sellers (Each Year)
2006 – 2012
2006 U.S Sales
2007 U.S Sales
2008 U.S Sales
2009 U.S Sales
2010 U.S Sales
2011 U.S Sales
2012 U.S Sales
2013 – 2019
2013 U.S Sales
2014 U.S Sales
2015 U.S Sales
2016 U.S Sales
2017 U.S Sales
2018 U.S Sales
2019 U.S Sales
2020 – Present
2020 U.S Sales
2021 U.S Sales
2022 U.S Sales
2023 U.S Sales
2024 U.S Sales
Canada
Research Hubs
Canada Sales Hub
Sales by Year (Totals)
Sales by Brand
Sales by Segment
Sales by Automaker
Best Sellers (Each Year)
2012 – 2015
2012 Canada Sales
2013 Canada Sales
2014 Canada Sales
2015 Canada Sales
2016 – 2019
2016 Canada Sales
2017 Canada Sales
2018 Canada Sales
2019 Canada Sales
2020 – 2021
2020 Canada Sales
2021 Canada Sales
China
Research Hubs
China Sales Hub
Sales by Year (Totals)
Sales by Brand
Sales by Segment
Sales by Automaker
Best Sellers (Each Year)
2015 – 2018
2015 China Sales
2016 China Sales
2017 China Sales
2018 China Sales
2019 – Present
2019 China Sales
2020 China Sales
2021 China Sales
2022 China Sales
Europe
Research Hubs
Europe Sales Hub
Sales by Year (Total Market)
Sales by Country (Individual)
Sales by Brand
Sales by Segment
Sales by Automaker
Best Sellers (Each Year)
2012 – 2015
2012 Europe Sales
2013 Europe Sales
2014 Europe Sales
2015 Europe Sales
2016 – 2019
2016 Europe Sales
2017 Europe Sales
2018 Europe Sales
2019 Europe Sales
2020 – Present
2020 Europe Sales
2021 Europe Sales
2022 Europe Sales
Rest of World
Global Data
Global Data Hub
180+ Country Data (A to Z)
Worldwide Sales by Region
Worldwide Sales by Country
Regional Reports (All Years)
Africa Sales (All Years)
Asian Sales (All Years)
European Sales (All Years)
North America Sales (All Years)
South America Sales (All Years)
Oceania Sales (All Years)
Regional Hubs
Africa (by Country)
Asia (by Country)
Europe (by Country)
North America (by Country)
South America (by Country)
Oceania (by Country)
Popular Markets
Brazil Sales
China Sales
Germany Sales
Japan Sales
U.K Sales
U.S Sales
Brands
A to D
Acura
Alfa Romeo
Alpine
Aston Martin
BAIC
Baojun
Bentley
Bestune
Bisu
BMW
Borgward
Brilliance
Buick
BYD
Cadillac
Changan
Changhe
Chery
Chevrolet
Chrysler
Citroën
Cos
Dacia
Daewoo
Daihatsu
Dearcc
Denza
D to H
Dodge
Dongfeng
Dorcen
DR Motor
DS Automotive
Enranger
Everus
FAW Auto
Ferrari
Fiat
Ford
Foton
GAC Auto
Geely
Genesis
GMC
Gonow
Great Wall
Hafei
Haval
Hawtai
Honda
Hongqi
Huanghai
Huansu
Hummer
Hyundai
H to M
Infiniti
Isuzu
JAC Motors
Jaguar
Jeep
Jetour
Jetta
Jiangnan
Jinbei
JMC
Jonway
Karry
Kia
Lamborghini
Lancia
Land Rover
Landwind
Leading Ideal
Leopaard
Levdeo
Lexus
Lifan
Lincoln
Link Tour
Lotus
Luxgen
Mahindra
M to S
Maserati
Maxus
Mazda
McLaren
Mercedes-Benz
Mercury
MG
Mini
Mitsubishi
Morgan
Neta
NIO
Nissan
Opel-Vauxhall
Ora
Peugeot
Plymouth
Pontiac
Porsche
Qiteng
Qoros
RAM
Range Rover
Renault
Roewe
Rolls-Royce
Seat
S to Z
Sitech
Skoda
Smart
Soueast
SsangYong
Subaru
Suzuki
SWM Motor
Tesla
Toyota
Triumph
Venucia
VGV
Volkswagen
Volvo
Weltmeister
Wey Auto
Wuling
Xpeng
Yema
YGM
Yudo
Zhidou
Zotye
ZX Auto
Models
Automakers
All Automakers
Daimler AG
Ford Motor Company
General Motors
Honda Motor Company
Hyundai Motor Group
Mazda Motor Corporation
Nissan Motor Company
Subaru Corporation
Tesla Inc
Toyota Motor Corporation
Jaguar Land Rover (JLR)
Research
Best of 2021
Best of 2022
Best of 2023
Best of 2024
Car Reviews
Best Car Lists
Members
Sign in
Become A Member
Reading
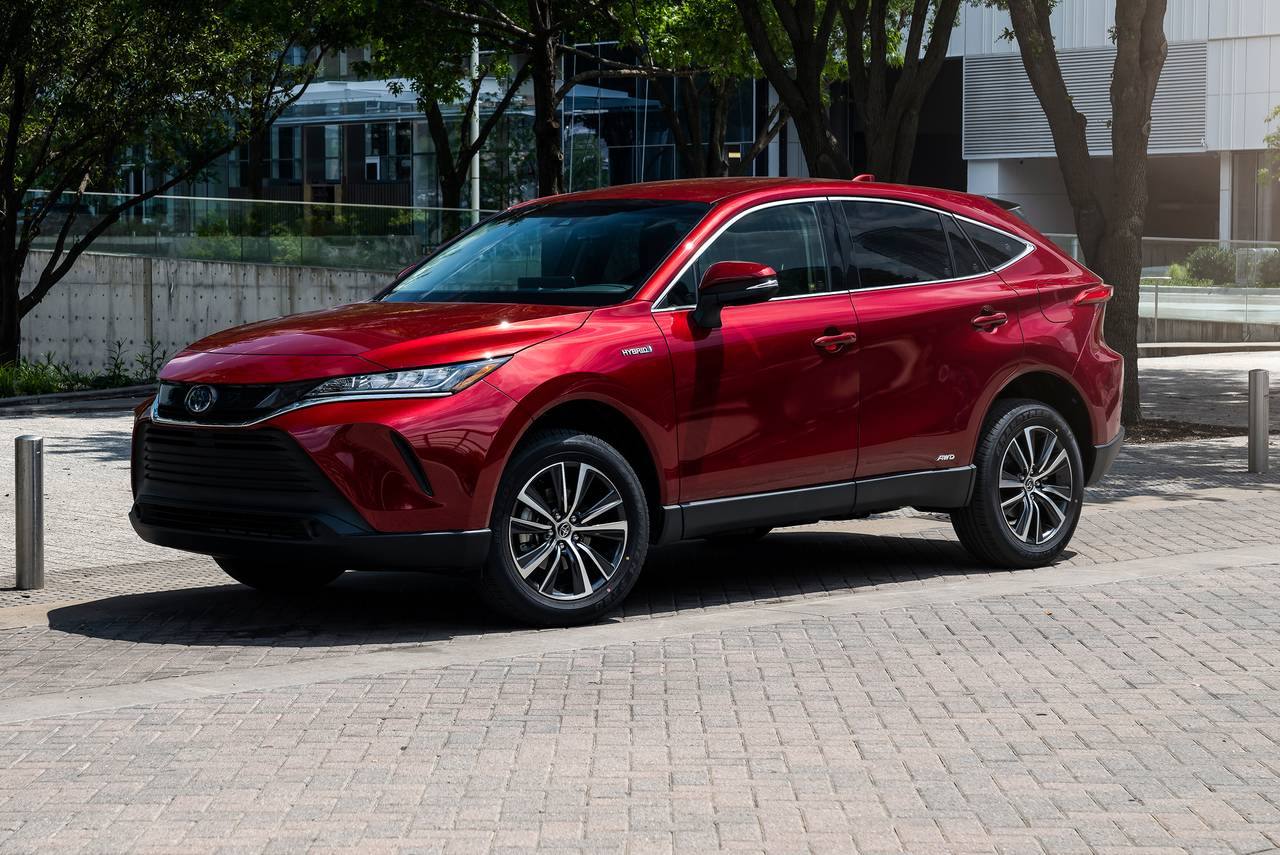
Toyota Venza
Share
Tweet
Toyota Venza
U.S
Research Hubs
US Sales Hub
Sales by Year (Totals)
Sales by Brand
Sales by Segment
Sales by Automaker
Best Sellers (Each Year)
2006 – 2012
2006 U.S Sales
2007 U.S Sales
2008 U.S Sales
2009 U.S Sales
2010 U.S Sales
2011 U.S Sales
2012 U.S Sales
2013 – 2019
2013 U.S Sales
2014 U.S Sales
2015 U.S Sales
2016 U.S Sales
2017 U.S Sales
2018 U.S Sales
2019 U.S Sales
2020 – Present
2020 U.S Sales
2021 U.S Sales
2022 U.S Sales
2023 U.S Sales
2024 U.S Sales
Canada
Research Hubs
Canada Sales Hub
Sales by Year (Totals)
Sales by Brand
Sales by Segment
Sales by Automaker
Best Sellers (Each Year)
2012 – 2015
2012 Canada Sales
2013 Canada Sales
2014 Canada Sales
2015 Canada Sales
2016 – 2019
2016 Canada Sales
2017 Canada Sales
2018 Canada Sales
2019 Canada Sales
2020 – 2021
2020 Canada Sales
2021 Canada Sales
China
Research Hubs
China Sales Hub
Sales by Year (Totals)
Sales by Brand
Sales by Segment
Sales by Automaker
Best Sellers (Each Year)
2015 – 2018
2015 China Sales
2016 China Sales
2017 China Sales
2018 China Sales
2019 – Present
2019 China Sales
2020 China Sales
2021 China Sales
2022 China Sales
Europe
Research Hubs
Europe Sales Hub
Sales by Year (Total Market)
Sales by Country (Individual)
Sales by Brand
Sales by Segment
Sales by Automaker
Best Sellers (Each Year)
2012 – 2015
2012 Europe Sales
2013 Europe Sales
2014 Europe Sales
2015 Europe Sales
2016 – 2019
2016 Europe Sales
2017 Europe Sales
2018 Europe Sales
2019 Europe Sales
2020 – Present
2020 Europe Sales
2021 Europe Sales
2022 Europe Sales
Rest of World
Global Data
Global Data Hub
180+ Country Data (A to Z)
Worldwide Sales by Region
Worldwide Sales by Country
Regional Reports (All Years)
Africa Sales (All Years)
Asian Sales (All Years)
European Sales (All Years)
North America Sales (All Years)
South America Sales (All Years)
Oceania Sales (All Years)
Regional Hubs
Africa (by Country)
Asia (by Country)
Europe (by Country)
North America (by Country)
South America (by Country)
Oceania (by Country)
Popular Markets
Brazil Sales
China Sales
Germany Sales
Japan Sales
U.K Sales
U.S Sales
Brands
A to D
Acura
Alfa Romeo
Alpine
Aston Martin
BAIC
Baojun
Bentley
Bestune
Bisu
BMW
Borgward
Brilliance
Buick
BYD
Cadillac
Changan
Changhe
Chery
Chevrolet
Chrysler
Citroën
Cos
Dacia
Daewoo
Daihatsu
Dearcc
Denza
D to H
Dodge
Dongfeng
Dorcen
DR Motor
DS Automotive
Enranger
Everus
FAW Auto
Ferrari
Fiat
Ford
Foton
GAC Auto
Geely
Genesis
GMC
Gonow
Great Wall
Hafei
Haval
Hawtai
Honda
Hongqi
Huanghai
Huansu
Hummer
Hyundai
H to M
Infiniti
Isuzu
JAC Motors
Jaguar
Jeep
Jetour
Jetta
Jiangnan
Jinbei
JMC
Jonway
Karry
Kia
Lamborghini
Lancia
Land Rover
Landwind
Leading Ideal
Leopaard
Levdeo
Lexus
Lifan
Lincoln
Link Tour
Lotus
Luxgen
Mahindra
M to S
Maserati
Maxus
Mazda
McLaren
Mercedes-Benz
Mercury
MG
Mini
Mitsubishi
Morgan
Neta
NIO
Nissan
Opel-Vauxhall
Ora
Peugeot
Plymouth
Pontiac
Porsche
Qiteng
Qoros
RAM
Range Rover
Renault
Roewe
Rolls-Royce
Seat
S to Z
Sitech
Skoda
Smart
Soueast
SsangYong
Subaru
Suzuki
SWM Motor
Tesla
Toyota
Triumph
Venucia
VGV
Volkswagen
Volvo
Weltmeister
Wey Auto
Wuling
Xpeng
Yema
YGM
Yudo
Zhidou
Zotye
ZX Auto
Models
Automakers
All Automakers
Daimler AG
Ford Motor Company
General Motors
Honda Motor Company
Hyundai Motor Group
Mazda Motor Corporation
Nissan Motor Company
Subaru Corporation
Tesla Inc
Toyota Motor Corporation
Jaguar Land Rover (JLR)
Research
Best of 2021
Best of 2022
Best of 2023
Best of 2024
Car Reviews
Best Car Lists
Members
Sign in
Become A Member
Start typing to see results or hit ESC to close
Sales By Model
sales by brand
Market Brand Sales
Brand Sales (by Market)
US Auto Sales
See all results
Automotive Data & Analysis
Get the latest sales figures delivered right to your inbox!
Leave this field empty if you're human: