
MG Sales Data, Trends & Analysis for the U.S Automotive Market
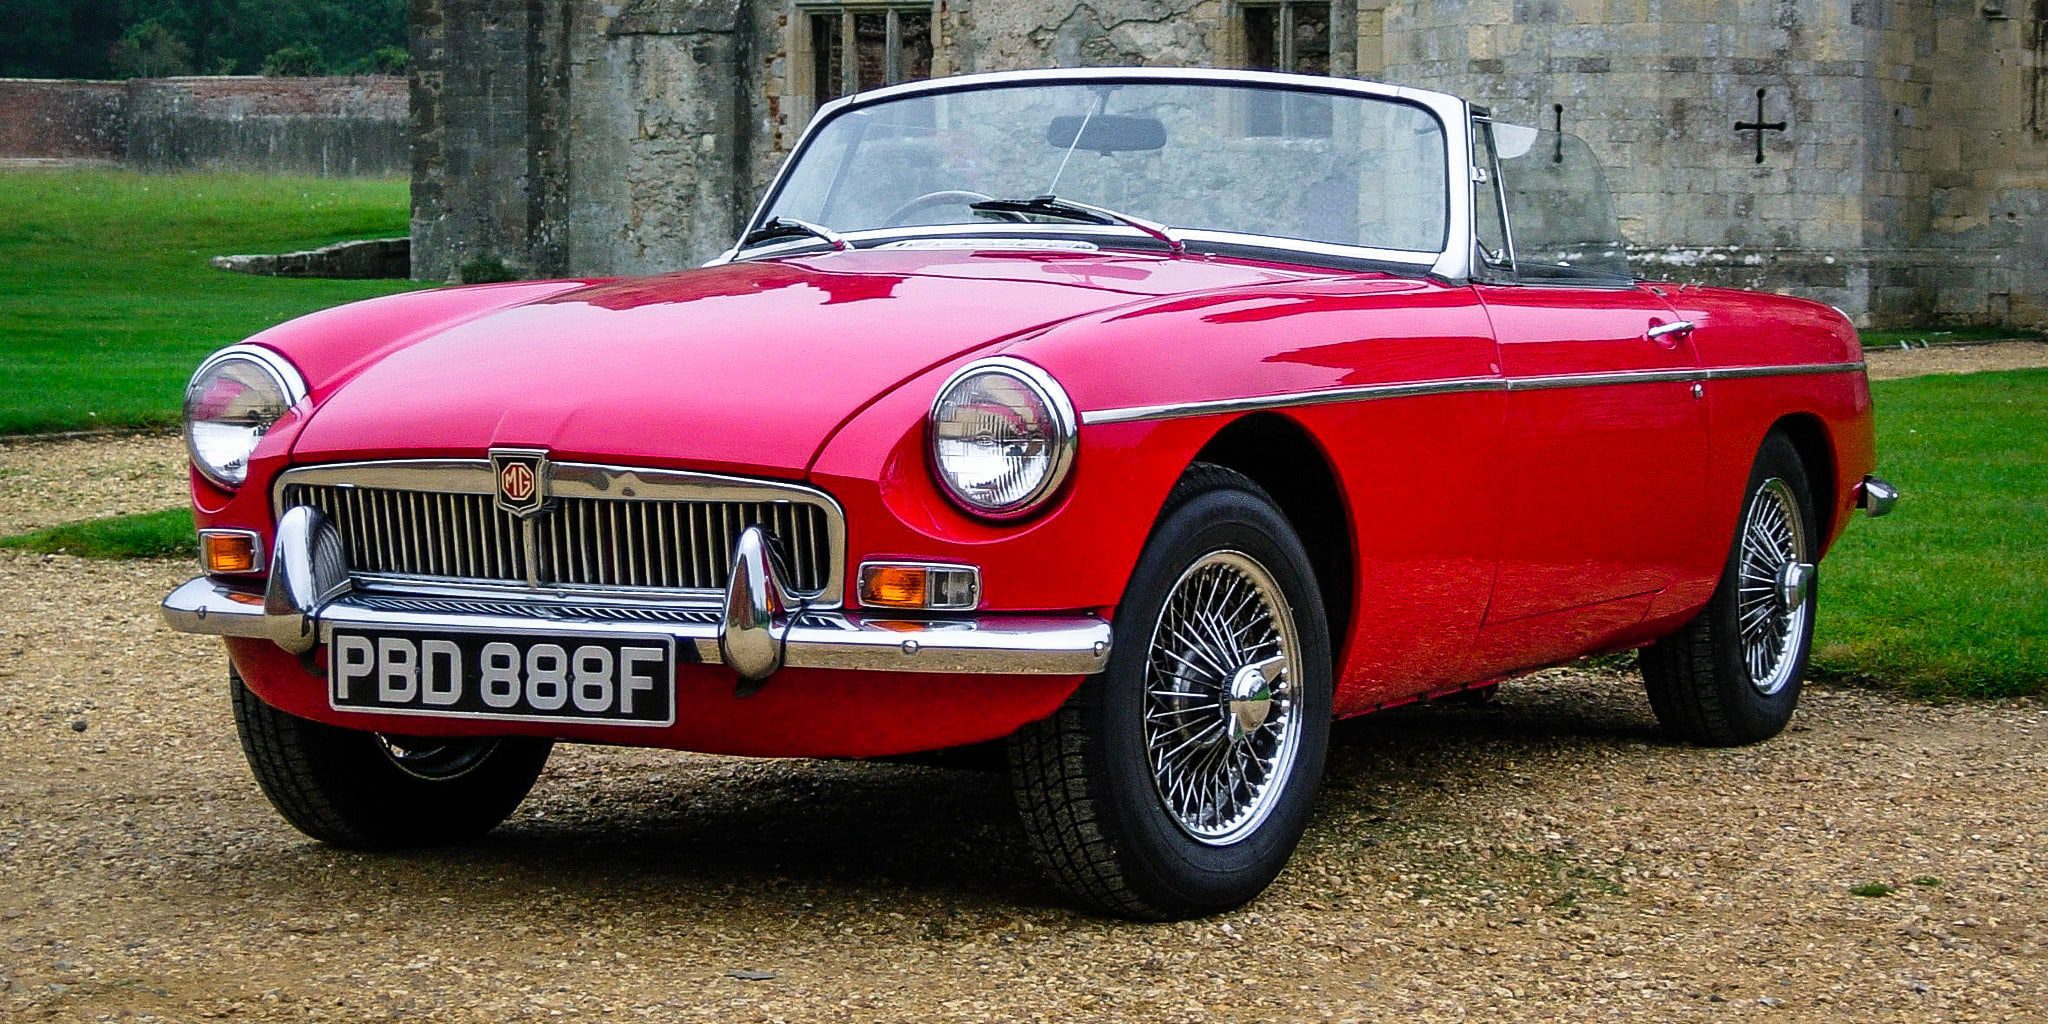
The combination of MG and United States is best known for ruining the design of the MGB because of Federal regulations. In 1974 the classic chrome grille of the MGB was replaced by a black rubber front, in possibly one of the most criticized makeovers in history. Also, to accommodate the regulations of a minimum headlight height, MG decided to simply increase the suspension of the MGB by one inch, which naturally had a devastating effect on the little sports car’s handling.
Considering most of MG’s production was exported to the US, the bumpers are understandable, but it took them two years to adjust the suspension geometry to account for the heavier bumpers and the higher ride height. In the fall of 1980 the MG factory was closed and the brand was reduced to a sporty badge on Austin Rover cars for the European market. Exports to the US ended at the same time.
MG Annual Sales Data in the United States
Below we have a table that shows total MG sales volumes for the U.S automotive market, broken out by year. This data captures all MG vehicle sales for the entire U.S automotive market.
| Year | Sales | YOY Change | Marketshare | Marketshare Change |
|---|---|---|---|---|
| 2007 | 3,131 | 0.00 | 0.06 | 0.00 |
| 2008 | 9,157 | 192.46 | 0.17 | 64.53 |
| 2009 | 10,602 | 15.78 | 0.13 | -29.38 |
| 2010 | 29,216 | 175.57 | 0.28 | 52.42 |
| 2011 | 50,191 | 71.79 | 0.45 | 37.05 |
| 2012 | 72,516 | 44.48 | 0.61 | 26.20 |
| 2013 | 74,684 | 2.99 | 0.52 | -17.08 |
| 2014 | 47,207 | -36.79 | 0.29 | -78.74 |
| 2015 | 62,632 | 32.68 | 0.34 | 13.87 |
| 2016 | 63,064 | 0.69 | 0.29 | -17.84 |
| 2017 | 121,807 | 93.15 | 0.53 | 45.91 |
| 2018 | 263,425 | 116.26 | 1.19 | 55.44 |
| 2019 | 306,669 | 16.42 | 1.52 | 21.51 |
| 2020 | 346,931 | 13.13 | 1.86 | 18.27 |
| 2021 | 535,896 | 54.47 | 2.65 | 29.96 |
| 2022 | 253,246 | -52.74 | 1.22 | -116.49 |
MG U.S Annual Sales Units & Growth Chart
Below is a visual representation of MG’s U.S sales units over time. We have both the MG sales units and the market share in the U.S market. Click on the items in the legend to see each series by itself.
MG U.S Growth Rate & Market Share Chart
Below is the annual growth rate for the MG brand in the U.S, shown against the MG’s marketshare changes in the U.S. This gives you a good look into how MG has faired against the other brands in terms of absolute sales and effect on marketshare. Click on the items in the legend to see each series by itself.
The Best-Selling MG Cars & SUVs in the U.S
Coming Soon


