Global Automotive Sales Data
The Leader In Automotive Sales Figures, Global Trends & Deep Analysis. Historical and Current Vehicle Sales Data by Country, Brand, Segment & Manufacturer.

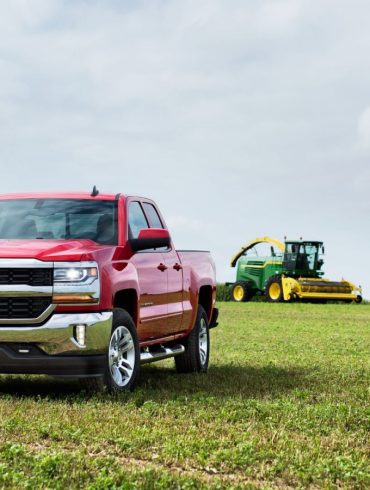
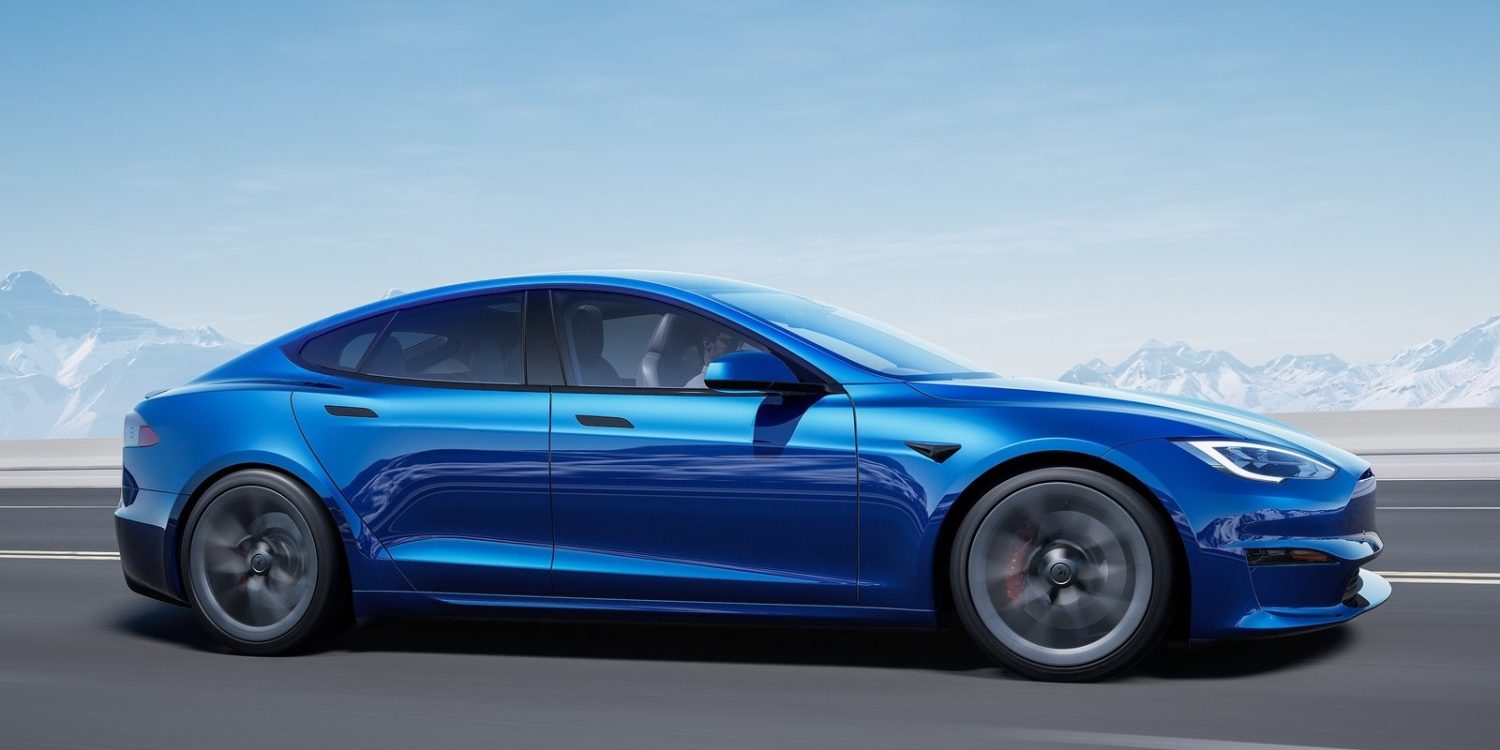
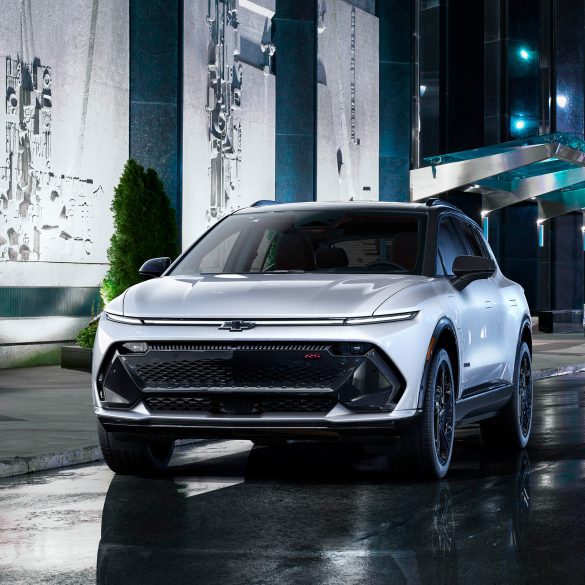

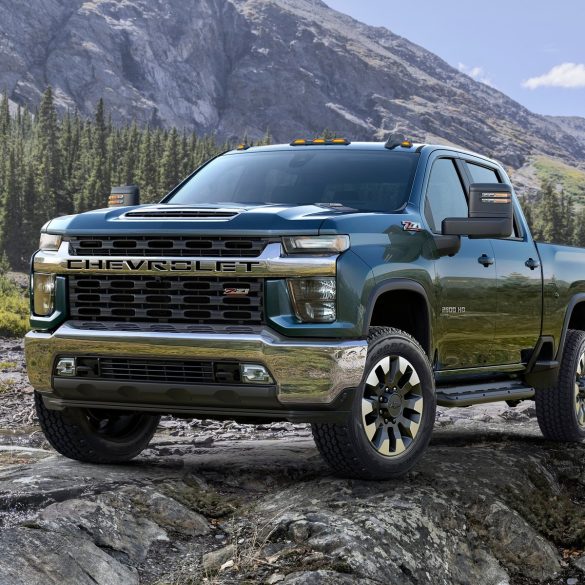
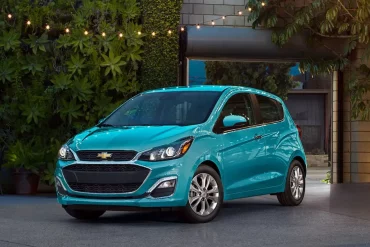

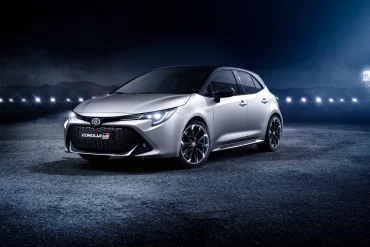


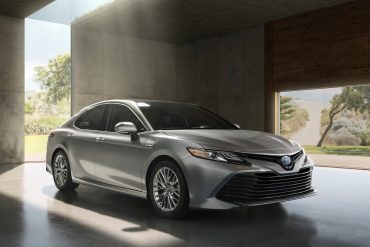
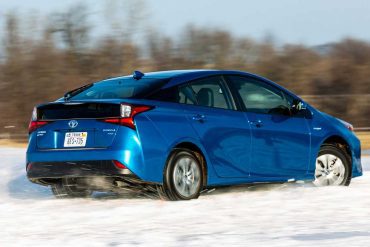
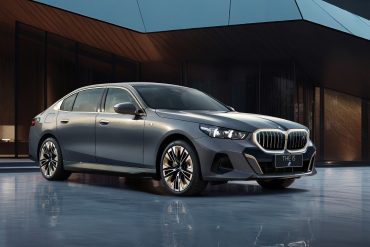
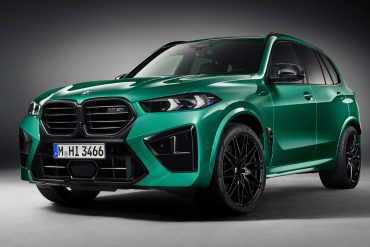


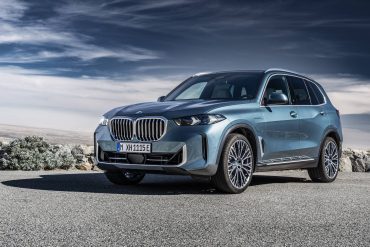

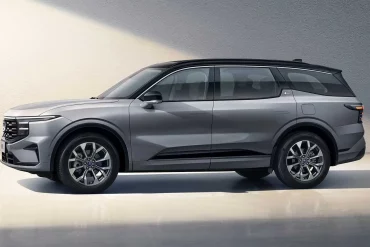
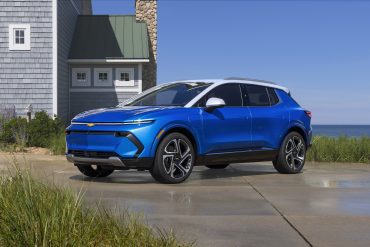

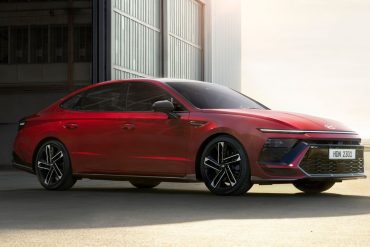

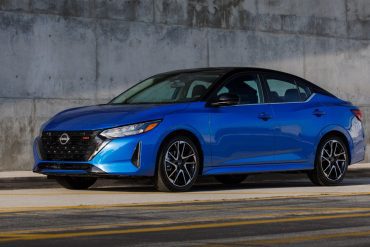
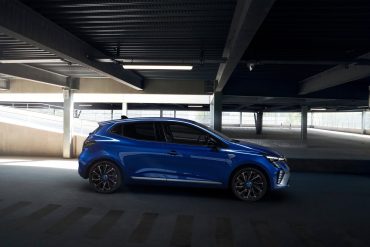

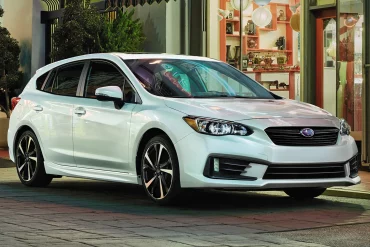
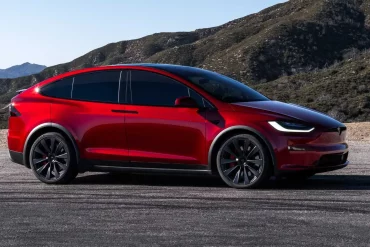
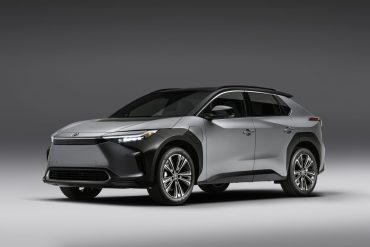
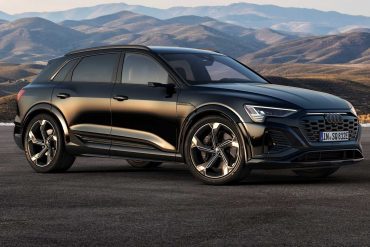
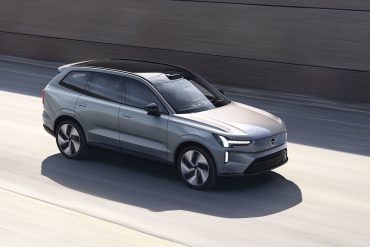

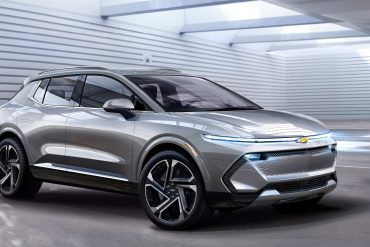

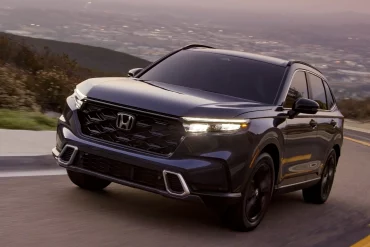
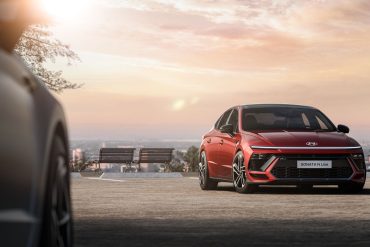
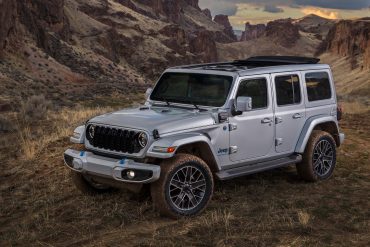

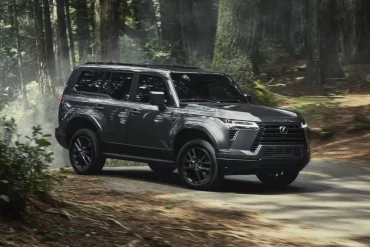
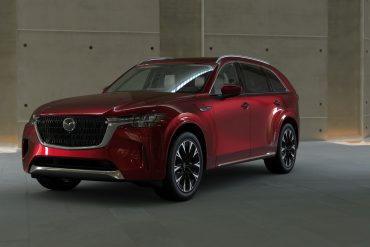

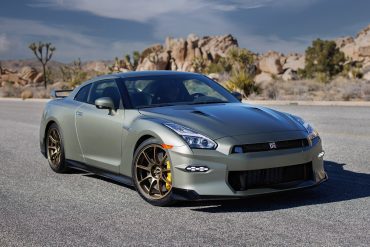
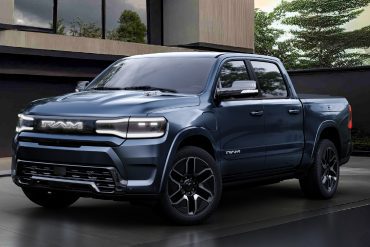

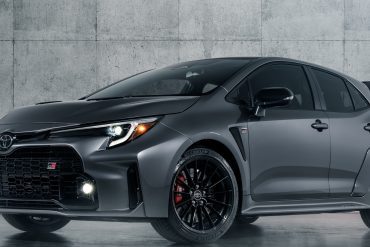

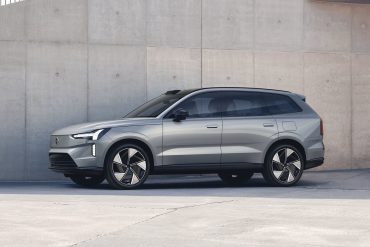


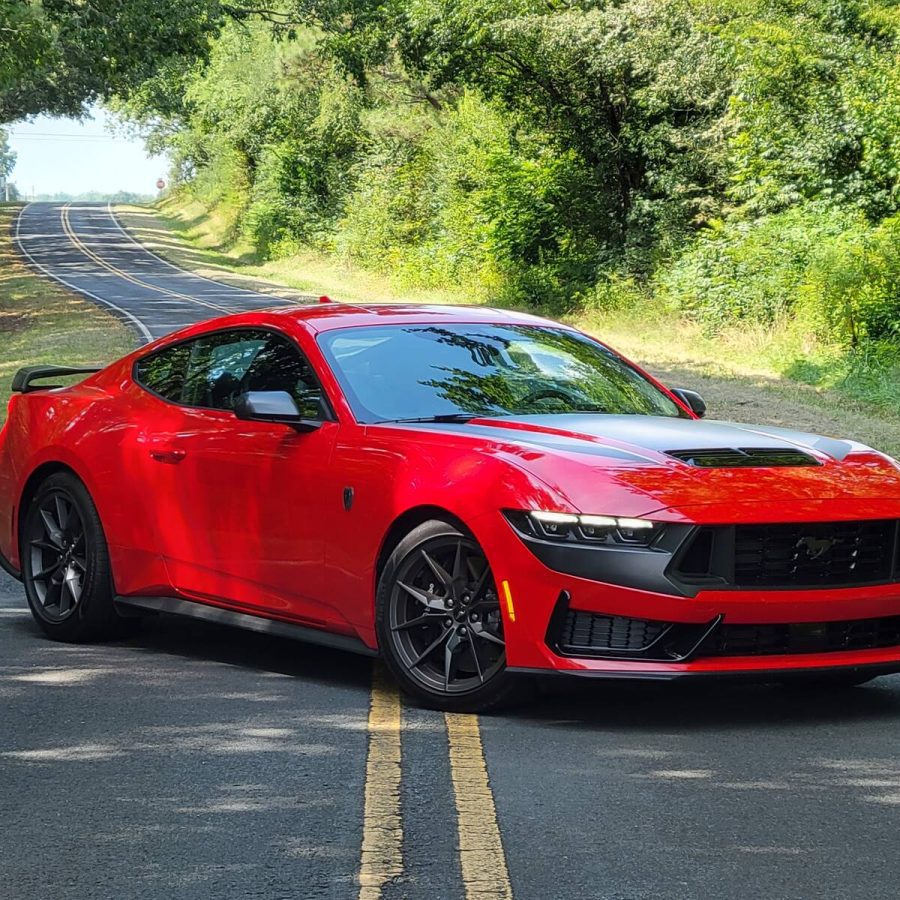
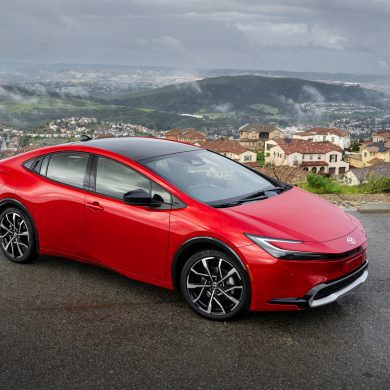
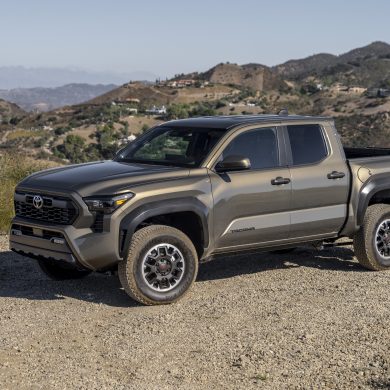
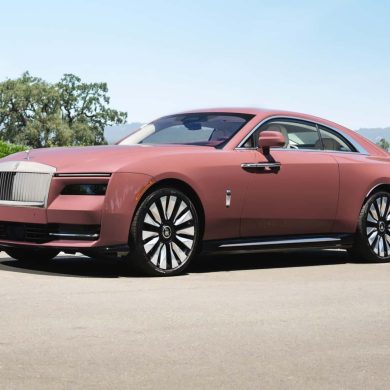
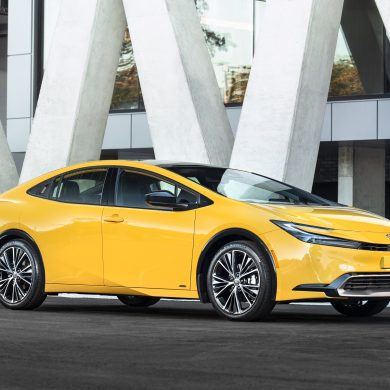
The Best Cars, SUVs & Trucks For Sale Today
See our top picks for the best SUVs, passenger cars, trucks and minivans for sale on the market today. Browse through our expert ratings.