2019 Chinese Automotive Sales by Brand – The Best-Selling Automotive Brands By Sales Volume
The Chinese car market has declined every single month in 2019, which means it has continued its losing streak to 18 consecutive months. One little ray of hope is that December 2019 showed the lowest rate of declines of the streak at -0.9%, and all the double digit losses were limited to the first half of the year. A grand total of 21.07 million passenger cars were delivered to Chinese dealers in China in 2019, which is 9.5% lower than 2018 and 13.4% lower than the peak of 24.3 million in 2017.
These figures exclude commercial vehicles, minivans and imported cars and reflect wholesale deliveries from the factory to the dealers. In the short term, the Beijing government is not planning any incentives to prop up the market, but it has ended its reduction of subsidies on one of the fastest growing segments of the Chinese car market: that of EVs and plug-in hybrids. Rather, the government seems to see this market contraction as an excellent opportunity to consolidate the market as (too) small players will be forced to close down or be taken over, while the larger state-owned carmakers also feel extra pressure to merge their operations and cut loss-making domestic brands. Also, China’s central government has pressured most major cities and provinces to adopt State 6 emissions rules (which are similar to the Euro 6 standards) on July 1, which caused local dealerships to offer steep discounts on vehicles that didn’t meet these standards. This is one of the reasons why wholesales have reduced their decline in the second half.
 In 2019, sales of all vehicle types declined, and unsurprisingly crossovers and SUVs took the smallest hit at -6.7% compared to -10.4% for sedans and a horrid -18.1% for MPVs. As a result, crossovers and SUVs now hold a record 43.6% share of the Chinese passenger car marke (up 1.3 percentage points), compared to 49.7% for sedans (down 0.5 percentage points) and 6.7% for MPVs (down 0.8 percentage points). Within those figures, sales of EVs and plug-in hybrids declined for the first time, as the government cut subsidies on those vehicles in the second half. In the first half of the year, sales of New Energy Vehicles jumped 57%, but the second half drop was so significant that full-year sales were down 4% to nearly 1.2 million. Sales of EVs were down 1.2% to nearly 972,000, while Plug-in Hybrid sales were down 15% to nearly 232,000.
The share of foreign brands increased for the third consecutive year to 61.2%, the highest it has been since 2015 and up 2.6 percentage points on 2018. This is a result of a 15.2% drop in sales of domestic brands, compared to a drop of just 5.4% in sales of foreign brands. Among these, the Japanese brands were the only group to inccrease sales in 2019 at +3.1%, while European brands were down just 1.9%, US brands down the most at -22.8% and South-Korean brands were down again by double digits at -17.9%. As a result, Japanese brands hit their highest share in China since 2011 at 21.7% and both US brands and South-Korean brands their lowest shares in China since 2004 at 9% and 4.6% respectively. European brands on the other hand took their highest share in China since 2004 at 25.9%.
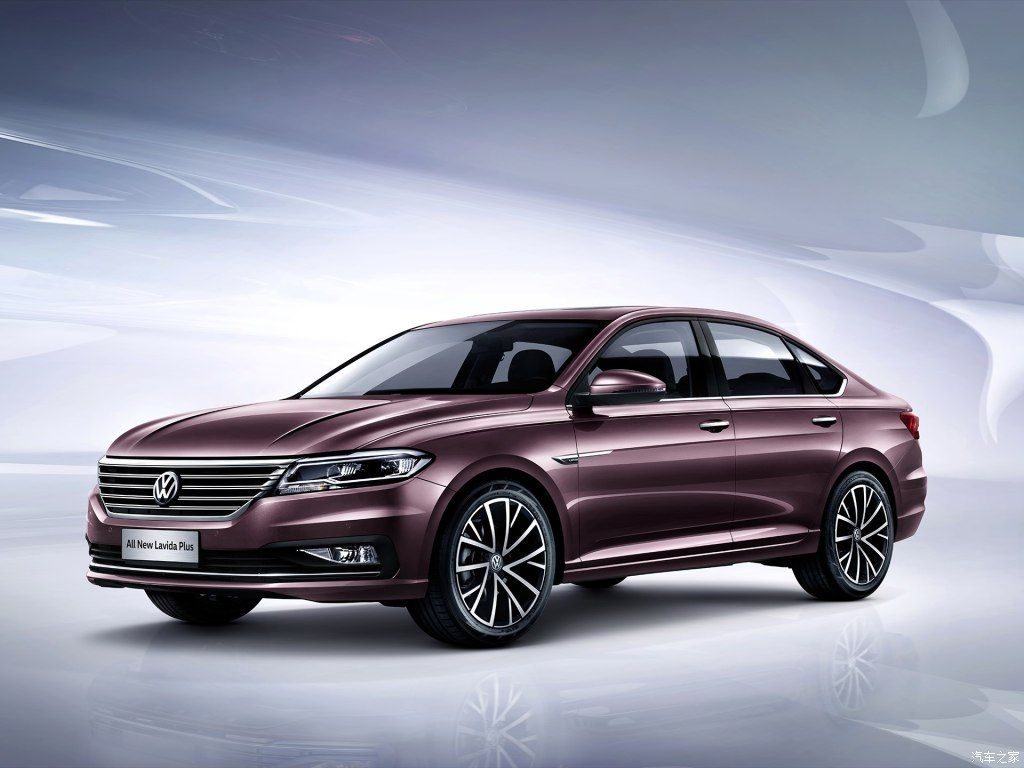
 Unsurprisingly, Volkswagen is still China’s best selling brand, and thanks to its onslaught of crossover launches in the last two years, it manages to keep its sales virtually stable (-0.9%) and this improves its market share to 14.6%. Its nearest rivals are closing the gap, but VW still sells more cars in China as Honda and Toyota combined. The latter takes the #3 spot from Geely as Toyota has now improved its ranking in each of the last three years, going from 6th in 2016 to 3rd in 2019.
Geely is the big loser in the top-5 with sales down 12% after its record of last year, with Nissan stable in 5th place and Buick in great difficulty at #6, dipping below the 1 million sales mark for the first time since 2014 and scoring its lowest sales since 2013, 350,000 sales below its peak in 2016 and 2017 and its lowest market share in at least 2 decades. Sister brand Chevrolet is down 23.6% this year, to its lowest sales since 2009. Changan beats the overall market and reclaims the #2 domestic brand, just ahead of Haval, as both leapfrog Baojun which is in trouble with sales down more than 31% on 2018 and more than 40% on 2017. Baojun’s sister brand Wuling is down 21.3% to half of its peak in 2014. Hyundai also loses market share at -13.3% and is now below its 2010 level and down 40% from its peak in 2016. Sister brand Kia is down even worse this year at -27.4% but it too is down nearly 40% from its peak in 2016 and below its 2010 level, and to its lowest market share since at least 2003.
 Beijing Automotive is down by more than a third at #21, with Huansu sales down by nearly two thirds (also posted separately at #42), and Ford is down by nearly 40% to just 1,1% market share, coming from 4.3% share in 2014 and back to its sales level of 2009 at below 250,000 sales. At least the brand broke its 30-month losing streak in December 2019, a sign the brand may have hit rock bottom. FAW is one of the big gainers in the top-30 thanks to surging sales of its upscale Hongqi brand (also posted separately at #37), while Zotye sales halved in 2019 to barely stay above 100k.
Jeep had a difficult year at -41.4%, but not as much as PSA with both Peugeot and Citroën down by more than half, from already low levels. Peugeot sales are down to the lowest since 2006 and its market share of just 0.3% is a new low, down from over 2% in 2014 and 2015. Citroën sales and market share have never been lower than now, since it launched in China in the 1980s. What’s even more embarrassing for PSA, is that Renault become the best selling French brand in China in December 2019, despite itself dropping over 63% for the year.
Records
 Honda sets a new annual sales record in China, passing 1.5 million sales for the first time, with Toyota also setting a new record, passing 1.4 million sales for the first time, as well as the 1.3 million sales mark. Meanwhile, fellow Japanese rival Nissan is down 0.3% on its record of last year, staying just below 1.2 million sales. Similarly, Audi is down 299 units on its record of last year at 620,000 sales while its two German luxury rivals Mercedes-Benz and BMW both set new annual sales records for their locally produced models, with 595,000 and 544,500 sales respectively. SAIC MG sets a new record at nearly 270,000 sales and sister brand SAIC Maxus almost doubles on its previous annual record with 60,500 sales. Both Volvo and Lynk & Co break their annual sales records at 132.000 and 128,000 sales respectively. FAW’s Hongqi brand nearly breaks the 100,000 sales mark for the first time ever, taking nearly half of total sales for FAW. Borgward enjoys a second youth, nearly 1,000 sales above its previous record of 2017 at over 45,000 sales. Infiniti continues to grow with its two locally produced models, breaking the 30,000 sales mark
Newcomers
 Best selling new brand in 2019 is VW’s Jetta brand at #44 with just over 49,000 wholesale deliveries in four months, which accidentally also makes it the most successful new brand launch in China ever. The only blemish on its record is the dip to just 9,225 sales in December, the lowest figure since launch, which could be a sign that dealers are not selling as many cars and withholding new factory orders. The Weltmeister EV brand is at #67 with just over 15,500 sales, at about the same level as Xpeng which started a few months ahead of it, but both startups can’t be satisfied with this level of sales, nor can rival Nio at #62 with just under 21,000 sales. Similarly, Geely’s EV brand Geometry also can’t break past the 1,400 average monthly sales of Xpeng and Weltmeister, while JAC-VW’s new EV brand Sol delivered just 1,639 cars to its dealers in October and November, as December deliveries were back to zero.
Brief note: when looking at total sales figures (including imports), 2019 marks the first year that Audi is not the leading luxury brand in China, and is in fact outsold by both Mercedes-Benz and BMW, albeit by a small margin. Mercedes-Benz took the #1 luxury brand title in China, with sales up 6.2% to 693,443, followed by BMW at 691,002 (up 13%), while Audi sales including imports were up just 4.1% to 690,083.
Please note these figures are for locally produced models only (unless stated otherwise), they exclude imported cars, which make up only a small portion of sales in China.
2019 Best Selling Car Brands In China
This data table looks at last month’s total automotive brand volumes in China by brand. We compare Chinese automotive brand sales with last year. With these sales numbers we also calculate a growth rate column so you can better gauge an individual automotive brands sales success in the Canadian market.
2019 Auto Brand Market Share Dynamics in China
This data table looks at total automotive sales and specific brand volumes in China. We compare Chinese automotive brand sales with last year. You can see the market share breakout visually for all the automotive brands selling in China.
2019 vs 2018 Auto Brand Sales in China
This chart simply takes each brand and compares their year to date sales with the year to date sales for the same time last year. Brands where the current bar is lower than the prior year bar have seen declines in sales year on year whereas brands with a larger current bar and lower prior bar are seeing growth in volumes year on year.
2019 Automotive Brand Sales Analysis in China
This chart might seem a little complicated at first but once you understand it is very helpful. First, the size of the area for each brand refers to their market share (i.e size). The bigger the circle the larger the brand in terms of sales volumes (YTD). The position of the circle in the chart along the left axis looks at the year to date growth of that brand. The higher the brand is on the chart, the more year to date growth it is seeing in sales volumes. Along the bottom axis you can see the total volumes shipped by that brand year to date.